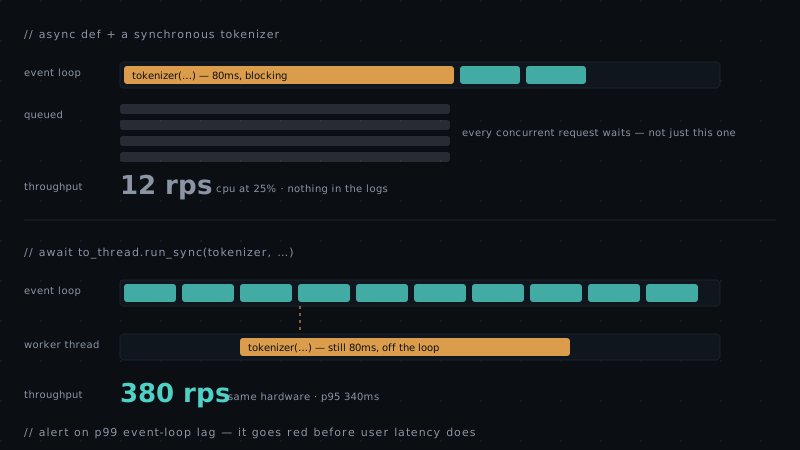
The symptom was odd enough to be worth writing down. A summarisation service ran fine under light load. Above roughly twenty concurrent requests, p95 latency went from 300ms to eleven seconds. CPU sat at 25%. Memory was flat. Nothing in the logs. Adding instances barely helped.
The cause was two lines of code, and the shape of this bug is common enough in ML-adjacent Python services that it's worth walking through properly.
What async actually promises
FastAPI runs your async def endpoints on a single event loop per worker
process. Concurrency comes from tasks voluntarily yielding at await points.
While your coroutine is executing Python between awaits, no other request in that worker
progresses. Not slowly — not at all.
That's fine when everything you do is either fast or awaited. It fails badly the moment you call something synchronous that takes real time.
@app.post("/summarise")
async def summarise(req: SummariseRequest) -> SummariseResponse:
    # This looks harmless. It is not.
    # A HuggingFace fast tokenizer on a 40KB document takes 60–90ms of
    # pure CPU, and it does not release the GIL in any useful way here.
    tokens = tokenizer(req.document, truncation=True, max_length=8192)

    result = await model_client.summarise(tokens)   # actually async
    return SummariseResponse(summary=result.text)
Do the arithmetic. If tokenisation blocks for 80ms, one worker can start at most 12.5 requests per second no matter how fast everything downstream is. Every other request sits in the loop's queue. Under 20 concurrent requests, the twentieth waits 1.6 seconds before its first line of code runs — and that's before any real work happens.
This is why CPU looked low. The process wasn't busy; it was serialised.
A blocking call in an async endpoint doesn't make that request slow. It makes every concurrent request slow, which is why the symptom looks like a capacity problem rather than a bug.
Finding them
You don't have to guess. Python's asyncio has a debug mode that logs any callback holding the loop longer than a threshold.
# Development only — the overhead is real.
import asyncio, logging

loop = asyncio.get_event_loop()
loop.set_debug(True)
loop.slow_callback_duration = 0.05          # warn on anything over 50ms
logging.getLogger("asyncio").setLevel(logging.WARNING)

# Executing a slow callback then produces:
#   WARNING:asyncio:Executing <Task ... summarise() at app/api.py:41>
#   took 0.087 seconds
Run your load test with that on and read the warnings. In our case it pointed directly at the endpoint and the line.
For production, a lighter-weight watchdog is better: a task that wakes on a fixed interval and reports how late it actually was. Lateness is loop lag, and loop lag is the metric that predicts this failure mode.
async def loop_lag_monitor(interval: float = 0.25) -> None:
    """Report how much later than scheduled we woke. That delta is
    time the loop spent blocked in someone else's synchronous code."""
    loop = asyncio.get_running_loop()
    while True:
        started = loop.time()
        await asyncio.sleep(interval)
        lag = loop.time() - started - interval
        event_loop_lag_seconds.observe(lag)      # Prometheus histogram
        if lag > 0.1:
            log.warning("event loop lag %.0fms", lag * 1000)
Alert on p99 loop lag above about 100ms. It goes red before your user-facing latency does, which makes it one of the more useful metrics on an ML service dashboard.
Fixing them
Option 1 — drop async from the endpoint
The one-word fix, and it's underrated. If a path function is defined with plain
def, FastAPI runs it in a thread pool instead of on the loop. The loop stays
free.
@app.post("/summarise")
def summarise(req: SummariseRequest) -> SummariseResponse:   # note: def, not async def
    tokens = tokenizer(req.document, truncation=True, max_length=8192)
    result = model_client.summarise_sync(tokens)
    return SummariseResponse(summary=result.text)
Good when the endpoint is mostly synchronous work. Bad when it's mostly awaiting network I/O, because you've now got a thread parked per in-flight request and the default pool is only around 40 threads wide.
Option 2 — offload the blocking part, keep the rest async
Usually the right answer. Push only the CPU-bound call into a thread, leave the awaits where they are.
from anyio import to_thread

@app.post("/summarise")
async def summarise(req: SummariseRequest) -> SummariseResponse:
    # Runs in AnyIO's worker thread pool; the loop keeps serving.
    tokens = await to_thread.run_sync(
        partial(tokenizer, req.document, truncation=True, max_length=8192)
    )
    result = await model_client.summarise(tokens)
    return SummariseResponse(summary=result.text)
Two things to get right. Size the pool deliberately rather than accepting the default —
anyio.to_thread.current_default_thread_limiter().total_tokens = 64 at
startup, tuned to your core count and workload. And remember this only helps for work
that releases the GIL or is genuinely I/O-bound. Pure-Python CPU loops will still contend;
those belong in a process pool or a separate service.
Option 3 — take it out of the request path
If the work is slow enough that neither of the above is comfortable — heavy preprocessing, large batch inference — it shouldn't be in a request at all. Accept, enqueue, return a job ID, and let a worker do it. Celery, ARQ, or a plain queue with your own consumer.
Now the streaming part
Everything above applies inside a StreamingResponse generator too, and it's
easier to get wrong there, because a blocking call inside the generator blocks between
every chunk.
@app.post("/summarise/stream")
async def summarise_stream(req: SummariseRequest) -> StreamingResponse:
    tokens = await to_thread.run_sync(partial(tokenizer, req.document))

    async def generate() -> AsyncIterator[str]:
        try:
            async for chunk in model_client.stream(tokens):
                # Anything synchronous in here stalls the loop once per
                # chunk. Post-processing goes downstream of the yield,
                # never between the await and it.
                yield f"data: {json.dumps({'text': chunk.text})}\n\n"
        except asyncio.CancelledError:
            # Client hung up. Release the upstream connection rather
            # than leaving it streaming into a socket nobody is reading.
            await model_client.abort()
            raise
        finally:
            yield "data: [DONE]\n\n"

    return StreamingResponse(
        generate(),
        media_type="text/event-stream",
        headers={
            "Cache-Control": "no-cache",
            "X-Accel-Buffering": "no",   # stop nginx buffering the stream
        },
    )
Three details in there that bite people:
Handle CancelledError. When a client disconnects mid-stream,
the generator is cancelled. If you don't catch it, your upstream model call keeps running
and keeps costing money. On a chat interface where users abandon generations constantly,
this is a real bill.
Disable proxy buffering. nginx buffers proxied responses by default, so
your carefully streamed tokens arrive in one lump at the end. X-Accel-Buffering:
no turns it off for that response. This is the single most common reason "streaming
works locally and not in production".
Don't build the whole string. Accumulating into a buffer and yielding at the end technically satisfies the type signature and defeats the entire purpose. It also hides itself well in code review.
Prove it stayed fixed
After the change, the same service handled 380 requests per second on one worker with p95 at 340ms. Same hardware, same model, same everything except where two lines of code ran.
Because this regresses silently — someone adds an innocuous synchronous call six months later — we added a test that fails on loop lag rather than trusting review to catch it.
@pytest.mark.asyncio
async def test_endpoint_does_not_block_the_loop(client):
"""Hammer the endpoint while measuring loop responsiveness.
A synchronous call reintroduced anywhere in this path will
push max lag well past the threshold and fail here."""
lags: list[float] = []
async def probe() -> None:
loop = asyncio.get_running_loop()
for _ in range(80):
t0 = loop.time()
await asyncio.sleep(0.01)
lags.append(loop.time() - t0 - 0.01)
probe_task = asyncio.create_task(probe())
await asyncio.gather(*(client.post("/summarise", json=PAYLOAD) for _ in range(20)))
await probe_task
assert max(lags) < 0.05, f"event loop blocked for {max(lags) * 1000:.0f}ms"The short version
- One blocking call in an
async defendpoint serialises every concurrent request in that worker - Low CPU with high latency under concurrency is the signature
- Find it with
loop.set_debug(True)locally and a loop-lag metric in production - Plain
deffor mostly-sync endpoints;to_thread.run_syncfor one slow call inside an async one - Catch
CancelledErrorin stream generators or pay for abandoned work - Set
X-Accel-Buffering: noor your proxy will un-stream your stream - Assert on loop lag in CI so it can't quietly come back